Feed Completeness Score: How We Measure It and Why It Matters
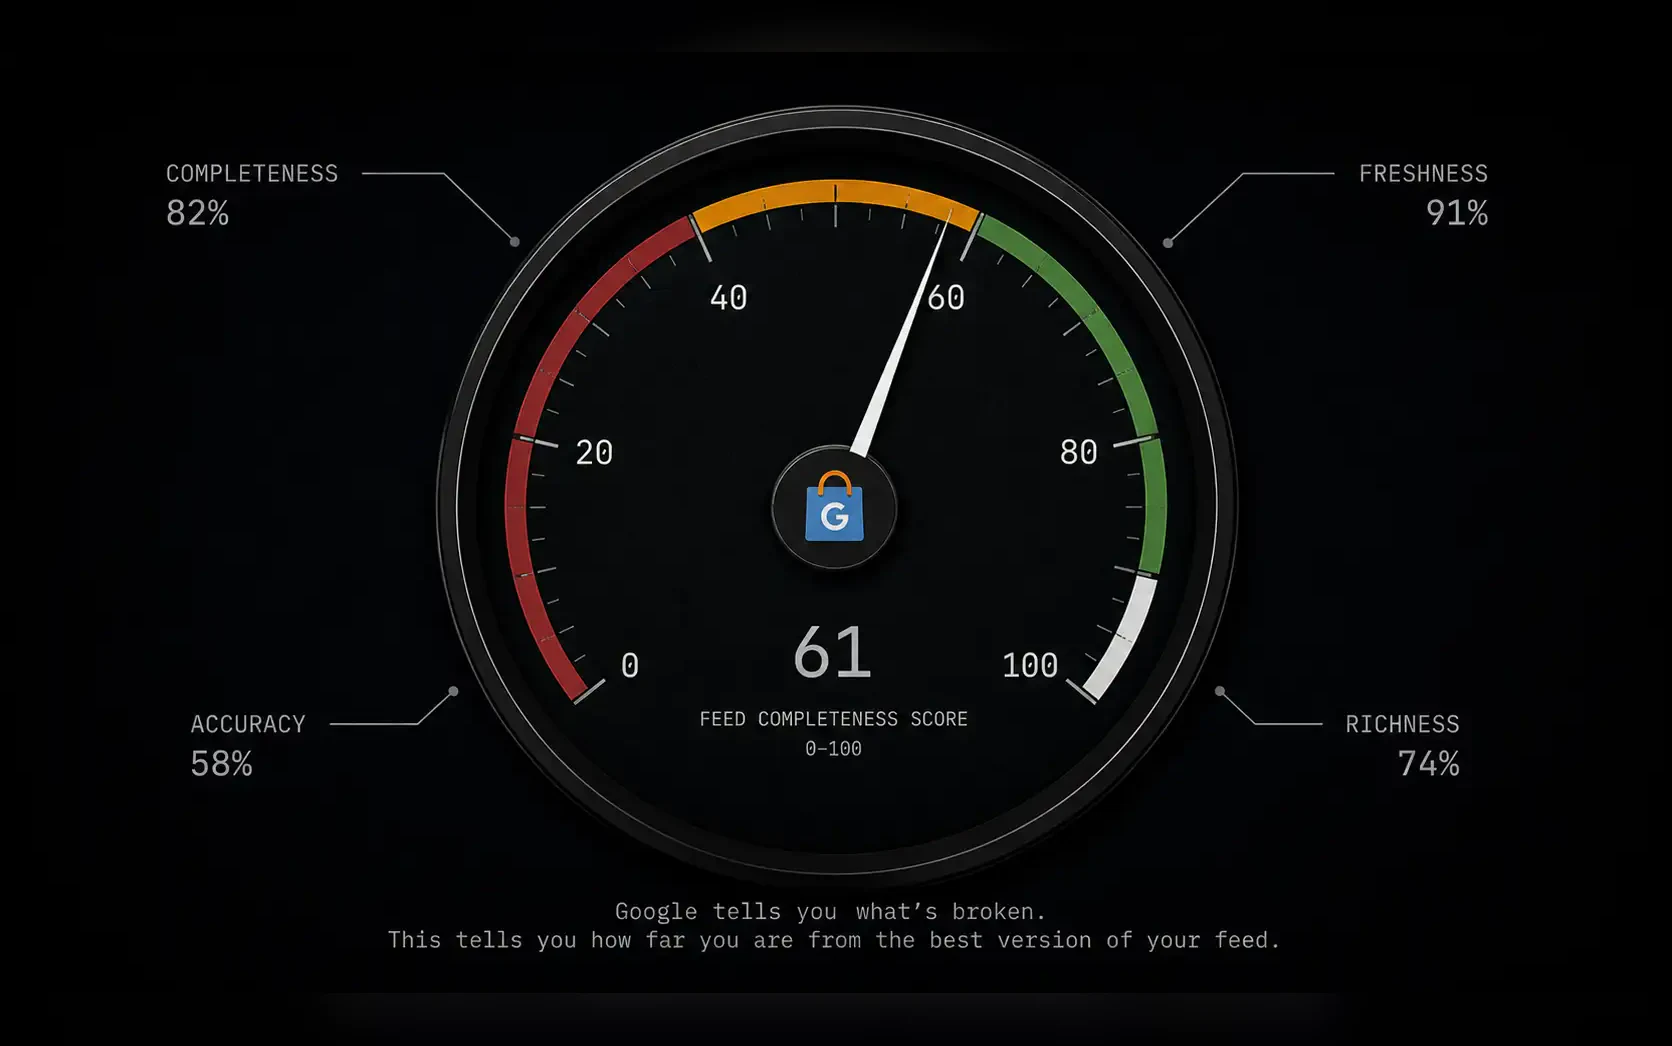
Feed Completeness Score is an internal 0–100 metric that doesn't exist anywhere in the Google panel — but should. We explain how we calculate it, what it measures, and why it's a better predictor of ROAS than any Google indicator.
Why Google's Indicators Are Not Enough
Merchant Center tells you whether products are technically accepted — that's binary: approved or disapproved. But between those poles there's a huge spectrum. A feed that's 100% approved can be catastrophically bad for performance if titles are generic, descriptions are empty, and GTINs are missing. Google won't tell you that. Approved doesn't mean optimized — it only means there are no technical errors preventing display.
Proof: in the audit of 14 companies we described earlier, every one of them had approved status on Merchant Center. The average Feed Completeness Score was 49/100. Approved and optimized are two completely different things.
What is Feed Completeness Score
Feed Completeness Score (FCS) is a number between 0 and 100 that says how filled the feed is with attributes that directly impact Shopping performance — not just technical requirements. We calculate it for every SKU in the catalog, and the final score is the weighted average of all SKUs.
It's not one number for the whole account — every product has its own score. This matters because the overall average can look solid while bestsellers have 80+ and the long tail of the catalog sits at 20–30.
Methodology: 7 Dimensions, 100 Points
The score is calculated across seven dimensions with different weights, because not all attributes are equally important for the auction:
| Dimension | Max Points | What is Measured |
|---|---|---|
| Title Quality | 25 | Format [Brand+Type+Attribute], length 70–150 chars, presence of search-relevant terms, no promotional text |
| GTIN Coverage | 20 | Valid EAN-13/UPC present; required for branded, acceptable without for private label — but must have identifier_exists=false |
| Description | 15 | Length 500+ characters, feature-first writing, presence of key attributes (material, dimensions, purpose) |
| Visual Quality | 15 | Resolution 800×800px+, clean background, no watermarks, has additional_image_link values |
| Attribute Completeness | 15 | Completeness of color, size, material, age group — depending on category |
| Category Precision | 5 | Google Taxonomy ID at level 3+ (not just parent category) |
| Custom Labels | 5 | Presence of at least one custom_label for margin or bid priority |
How to Interpret the Score
| Score | Status | What it means in practice |
|---|---|---|
| 0 – 30 | · Critical | Feed is technically approved but almost non-competitive in auction; PMax on such a feed is actively losing money |
| 31 – 50 | · Below Average | Typical auto-generated Shopify feed; visible, but yielding impressions to competitors with better feeds |
| 51 – 70 | · Average | Competitive for less competitive categories; in dense auctions (electronics, fashion) still losing positions |
| 71 – 85 | · Good | Feed that beats the market average; this range is the target for most of our clients |
| 86 – 100 | ✓ Excellent | Feed engineering at the highest level; realistically achievable for catalogs up to 2,000 SKUs with dedicated resources |
Why It Matters — and What It Predicts
The name comes from an internal joke: when someone says "your feed is good", we ask for the score. If they can't give a number, the assessment means nothing. FCS matters because it's measurable, repeatable, and comparable — you can track progress from sprint to sprint, compare categories within the catalog, and set a target before you start spending on campaigns.
On the sample we have, the correlation between FCS and ROAS is consistent: every increase in score of 10 points in the 30–70 range correlates with 8–14% higher ROAS over the following 4 weeks — provided bid strategy and budget don't change. It's not causation, but it's a signal we take seriously.
How to Check Your Own Score
You can make a rough FCS yourself: export the feed to a spreadsheet (Merchant Center → Products → Download) and for each of the 7 criteria above manually walk through the first 50 SKUs. The scoring table above gives the weights — anything below 70/100 on any dimension goes back on the improvement list.
For larger catalogs, doing it manually isn't practical — that's the problem we solve with a feed audit.
Want to know your catalog's exact FCS?
We'll complete the full audit in 48 hours.
Want this kind of result on your store?
Request a free analysis