State of E-commerce in 2026: 14 companies under the magnifying glass
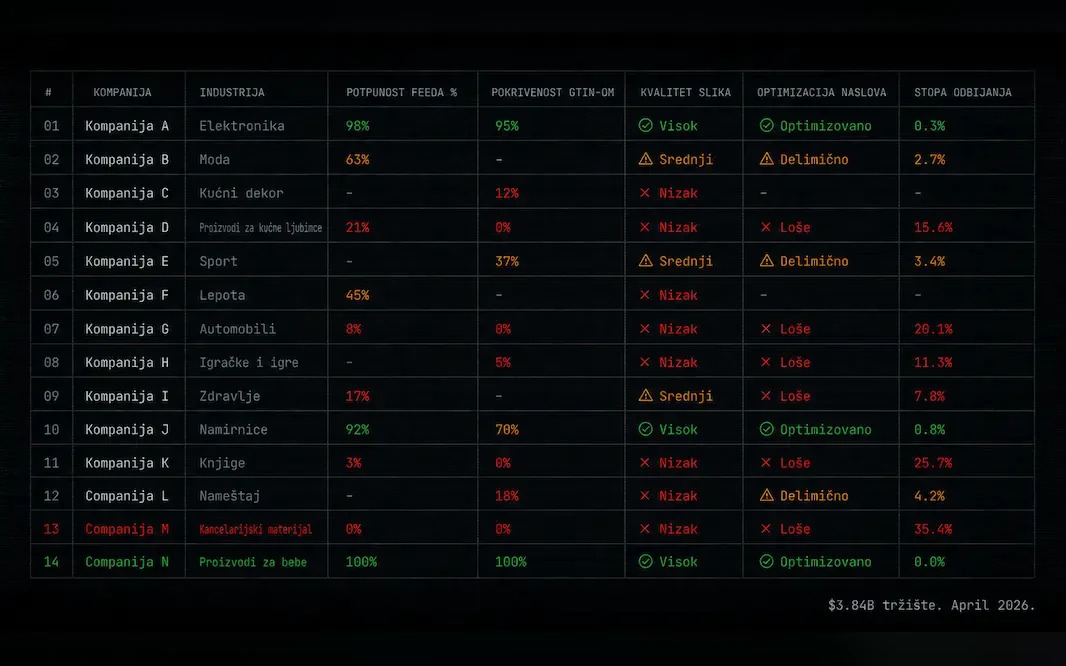
Internal audit of 14 e-commerce Google Shopping feeds. What most do poorly, what a few do brilliantly, and where the real competitive advantage lies.
Context: a growing market that also demands more
Internet penetration in the region is 87.2% in 2026, digital ad spend has exceeded 100 million euros, and the market capitalization of the e-commerce sector is estimated at between 1.2 and 3.8 billion dollars depending on the measurement methodology. Top retailers hold the peak of visits with 4–14 million monthly visits each. Behind them, a middle layer of several hundred companies fighting for the rest.
What market growth masks: competition is growing faster than average performance. More companies are spending more money on Google Shopping, but they are making the same mistakes — which means there is a growing gap between those who know what they are doing and those who just increase the budget and wait.
Audit Methodology
During January and February 2026, we reviewed publicly available Shopping ads and simulated a feed audit for 14 companies from five categories: electronics, fashion, sports, furniture, and beauty. The companies were selected based on the criterion of activity on Google Shopping — each had a minimum of 500 active Shopping ads. We used a combination of manual search, PageSpeed Insights, and Google Merchant Center diagnostic signals where they were publicly visible.
What we measured — 5 dimensions
Each company was evaluated on five dimensions of feed quality:
- Title quality — format, keyword relevance, attributes
- GTIN coverage — % of the catalog with correct identifiers
- Visual quality — resolution and consistency of images
- Attribute completeness — descriptions, categories, color, size, material
- Disapproval indicators — visible errors in live Shopping ads
Results: what we found
Without naming specific companies, here is the distribution of findings:
| Category | Number of companies | Average score (0–100) | Most common problem |
|---|---|---|---|
| Electronics | 3 | 61 / 100 | GTIN errors on no-name brands |
| Fashion / Apparel | 4 | 38 / 100 | Images without white background, short descriptions |
| Sport and Outdoor | 3 | 54 / 100 | Variants as separate products, poor title format |
| Furniture and Home | 2 | 44 / 100 | Dimensions and material not in title or description |
| Beauty and Cosmetics | 2 | 49 / 100 | Invalid GTINs, generic categories |
Average feed completeness score of all 14 companies: 49 / 100. Only two companies crossed the 70 mark — both from electronics, and both with visibly better positioning in Shopping results for competitive terms.
What poor feeds do specifically
These are not abstract problems — here are three concrete scenarios that we saw in live Shopping campaigns:
- An apparel company had 340 active Shopping ads, but all images had dark backgrounds with models. The CTR on those ads was almost half the category average (0.6% vs 1.1%), directly visible through public auction insights.
- A furniture company sold sofas with the title "Sofa type A-112 — brown" without dimensions, material, or brand. Buyers looking for a "fabric sofa 220cm" never see that ad — not because of the bid, but because Google doesn't know that's what they sell.
- A sports company had the same sneakers in 6 colors listed as 6 separate products without item_group_id. Each color competed in the auction with another color of the same model — the company was increasing its own CPC.
Who does it well — and why
The two companies that crossed 70/100 have one thing in common: the feed is not generated automatically from the CMS. Both have someone who actively maintains titles, regularly cleans Merchant Center Diagnostics, and tracks the disapproval rate. It's not rocket science — it's just discipline.
What sets them apart in Shopping results is tangible. For a search in the same category, the company with a feed score of 71 appears in the first position ahead of the company with a score of 38 — even when the budget of the company with the lower score is higher. Feed quality outweighs the bid when the difference is large enough.
What this means for you
The local e-commerce market is at a point where feed optimization is still a competitive advantage, not a hygienic minimum. Unlike western markets where every serious player has already optimized their feed to the maximum, here the average score is 49/100 — which means anyone who reaches 70+ is automatically ahead of a huge part of the competition. That window won't stay open for long, especially as AI Max increases the requirements for feed quality.
Where does your feed stand on this scale?
Find out in 48 hours with a free audit.
Follow this blog for future case studies and analyses.
Want this kind of result on your store?
Request a free analysis